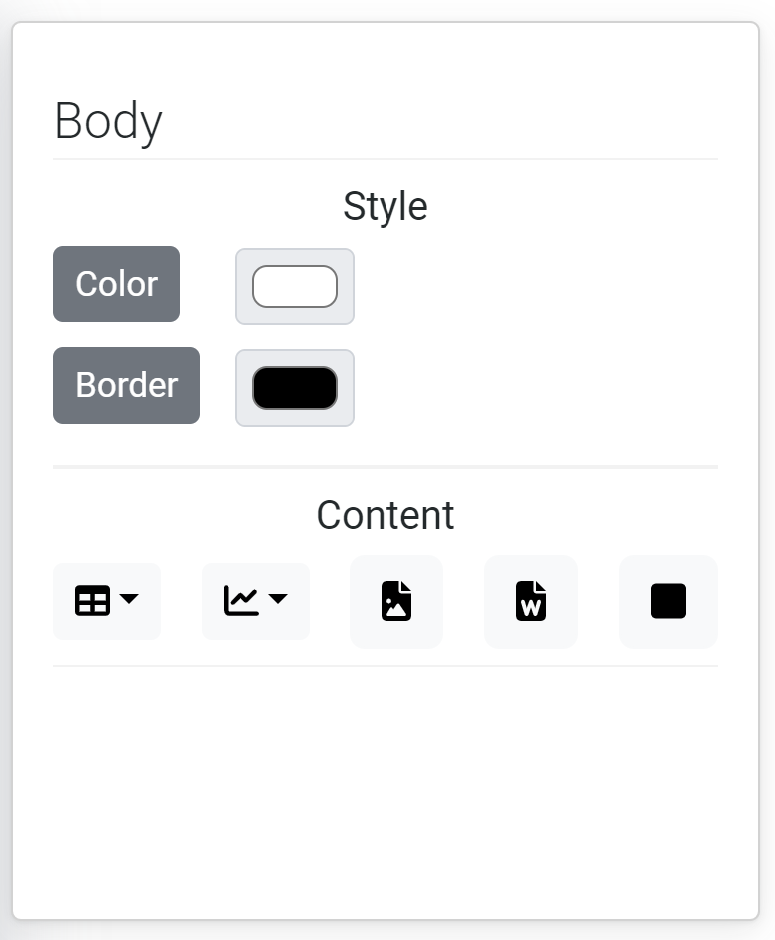
The content to be added is normally handled from the right side of the page preview:

Body is about the whole page, so editing a Color or Border style will be applied to the entire page.
Content
Please note that the tables and graphs are drawn with dummy data and has nothing to do with the measured data. To test what a final report will look like with measured (real) data, save the template, then go to the project dashboard and select generate report with the file name (xml) you just saved to.
Click on the following icons to add content.
Choose between Table, Highest values combined, Highest values separated, Transducer information, Event information, Noise compass and Table (Lden data)
Choose between Add graph level vs. time, Add graph level vs. frequency and statistics graph
Add container: This adds a container to insert other content into and to keep the added contents within.
Content tree
Copy/cut/paste/delete