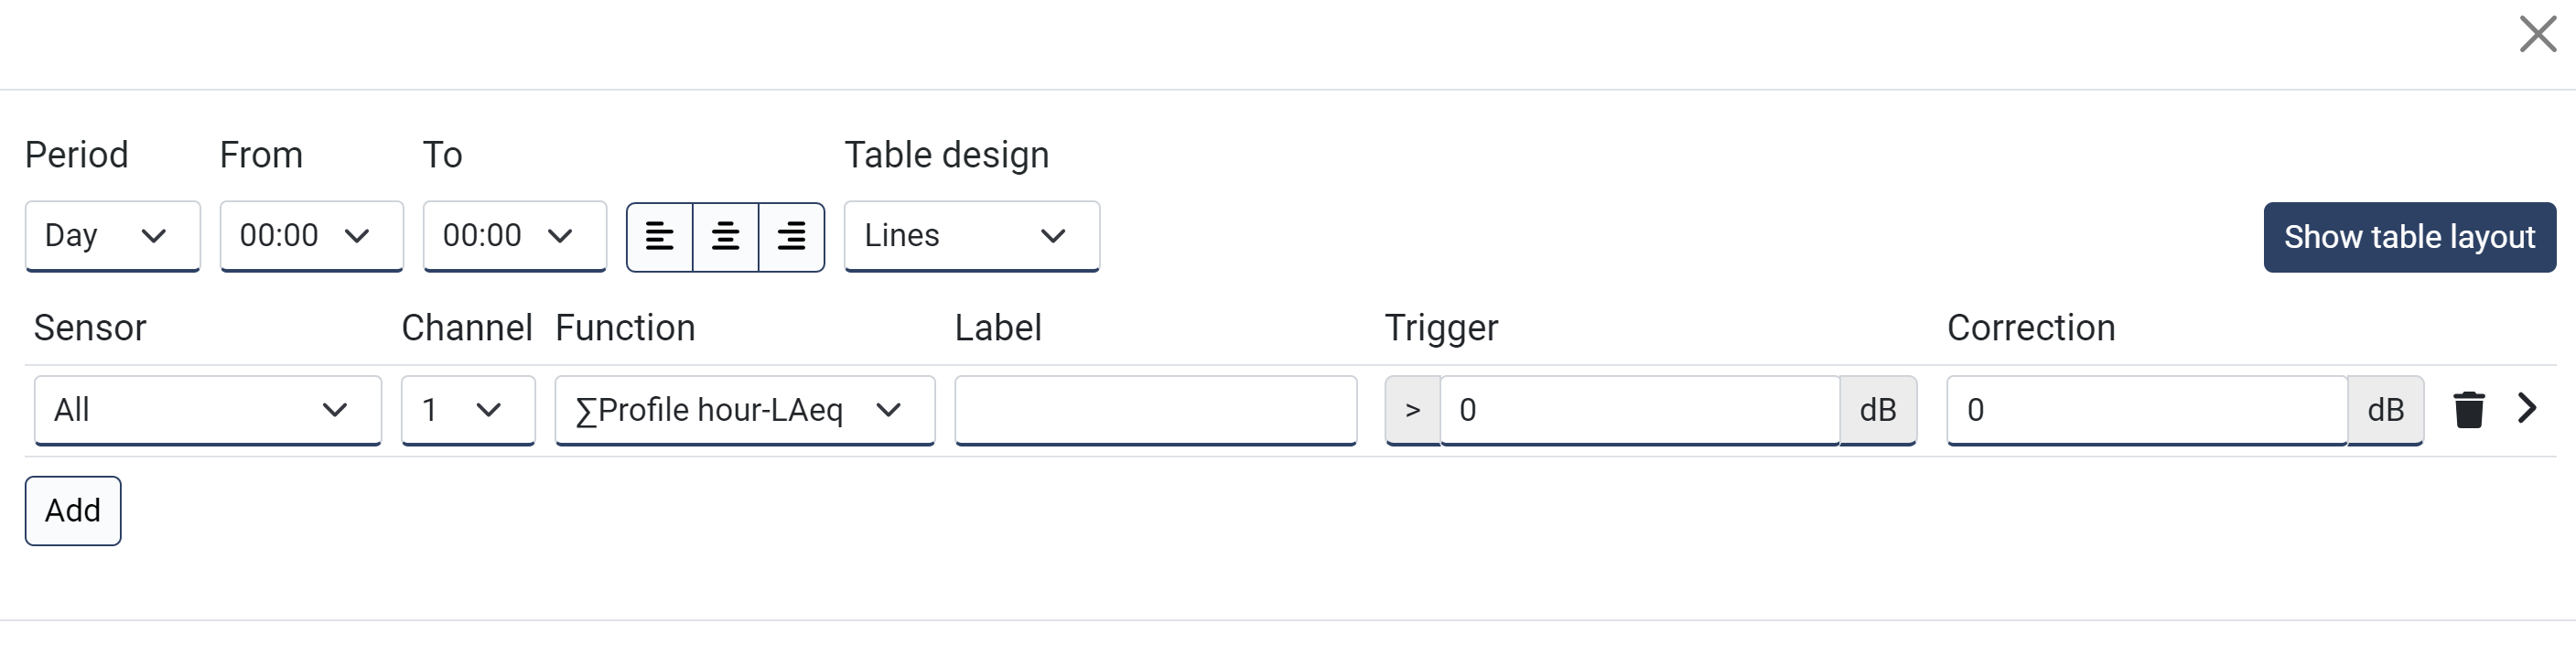
When the ![]() Add table button is clicked and Table is selected from the given drop-down menu, a window for setting up the table is shown:
Add table button is clicked and Table is selected from the given drop-down menu, a window for setting up the table is shown:
Field name |
Optional / Required |
Data in field |
Information |
|---|---|---|---|
Period |
Required |
Hour, Day or Total |
Time span of the table which is viewed. Hour is only selectable when the Period Day is set in the page settings. |
From/To |
Required |
Time |
Choose a time from and to which data is to be calculated and displayed. E.g., 00:00 to 00:00, 07:00 to 19:00 (day), 23:00 to 07:00 (night) or 07:00 to 07:00. |
Alignment |
Required |
Left, Center or Right |
This is the text alignment for the whole table. Default is left text alignment. |
Table Design |
Required |
Lines, Bordered or Borderless |
|
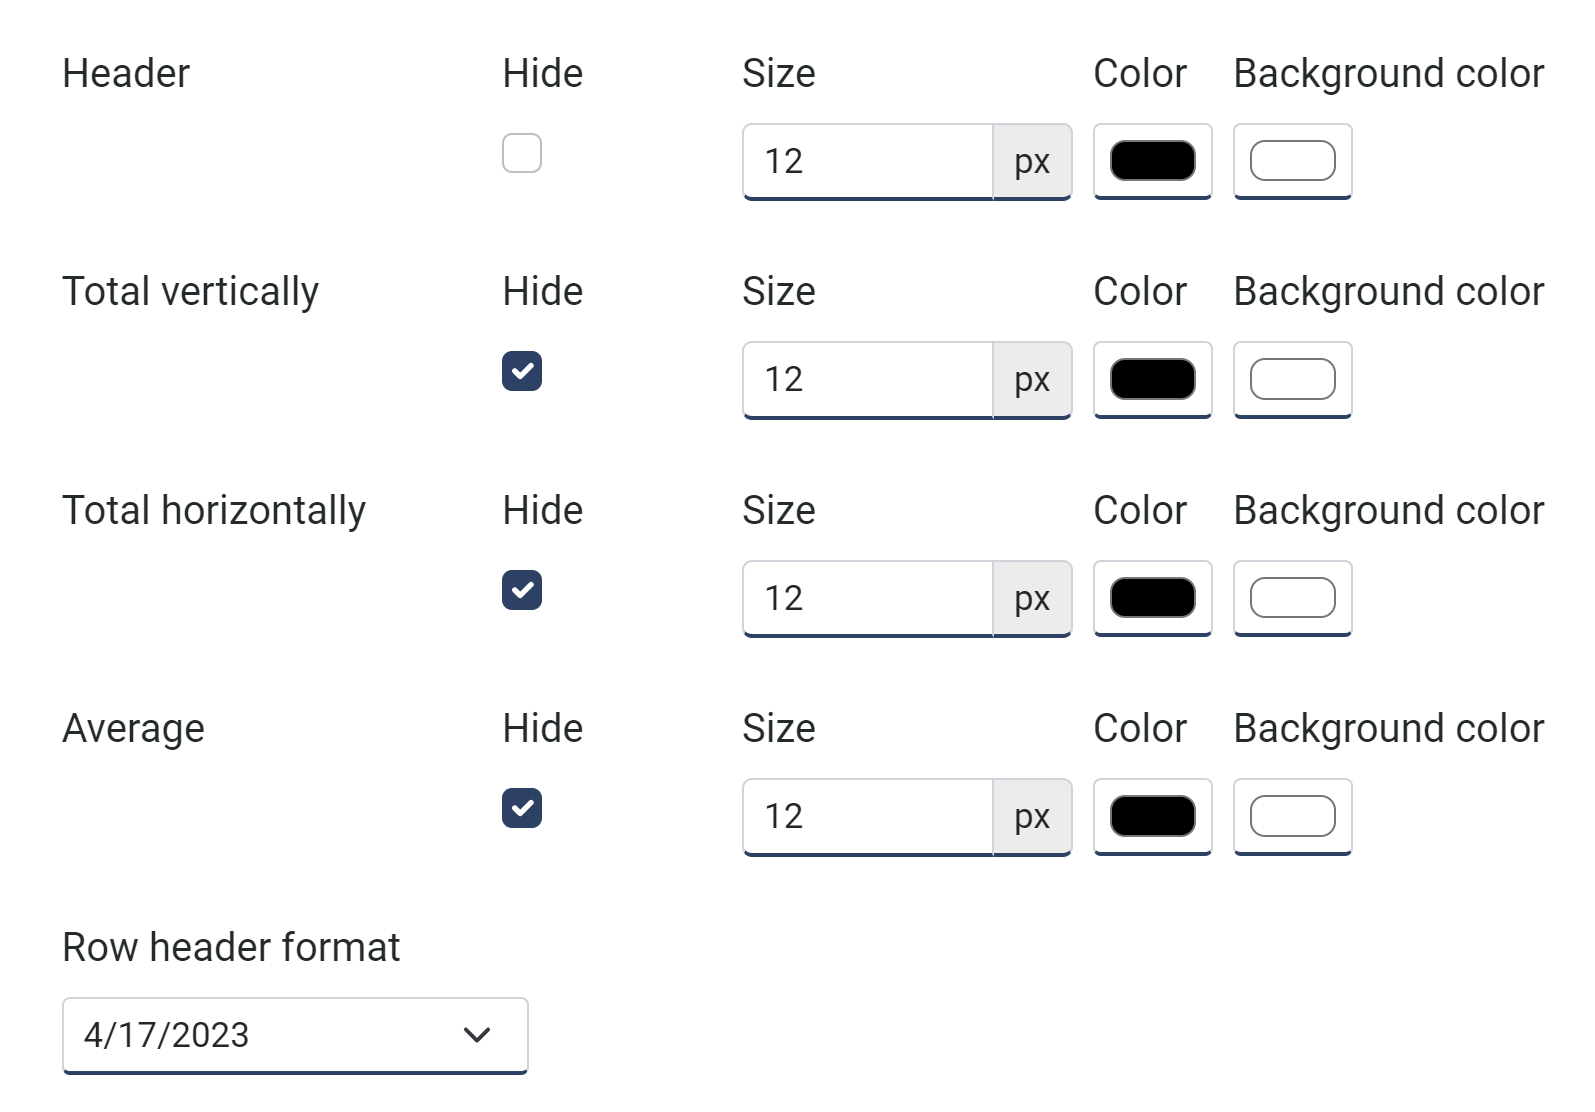
Show/Hide table layout
Press the Show table layout button in order to get more options for the table:
Field name |
Optional / Required |
Data in field |
Information |
|---|---|---|---|
Header |
Optional (hidden toggle) |
Size, Color, Background color |
This will create an extra row at the top with info about each column if shown. If it is hidden and the Period is set to Day or Total, the columns will be transposed for each time span with measurement data displayed. |
Total vertically |
Optional (hidden toggle) |
Size, Color, Background color |
This will create an extra row at the bottom with logarithmic summation of the numbers. |
Total horizontally |
Optional (hidden toggle) |
Size, Color, Background color |
This will create an extra column to the right with logarithmic summation of the numbers. |
Average |
Optional (hidden toggle) |
Size, Color, Background color |
This will create an extra column to the right with logarithmic averaging of the numbers. |
Row header format |
Optional |
Different date/time formats |
This will change the formatting of the first column showing the time and date for each row of measurement data. |
Column settings (sensor, profile etc.)
When pressing the Add button, a new line will be created representing one or more columns containing data from the measurements according to the parameters given:
Field name |
Optional / Required |
Data in field |
Information |
|---|---|---|---|
Sensor |
Required |
All or single |
Select what sensor to show data from. If you are creating a generic report for several projects, it is required to use All. Selecting a single sensor will only work in this particular project as the NorCloud sensor ID are unique for each project even if their tic id is the same. |
Channel |
Required |
1 or 2 |
Channel 2 only applies to Nor150. |
Function |
Required |
Profile and function |
Choose from Profile hour, TriggerTime, TriggerTimePst and Weather (requires a weather station connected). The TriggerTime or TriggerTimePst shows the time or percentage of time where the given function has been above the given level. |
Label |
Optional |
Text |
If nothing is typed here, standard notations are used depending on what profile and function is selected. |
Trigger |
Optional |
See below |
See below |
Correction |
Optional |
Number |
This is a dB correction that should be added to the numbers displayed for this particular line (column(s)). |
Trigger settings
On each sensor line, press the ![]() button on the right to open the trigger settings:
button on the right to open the trigger settings:
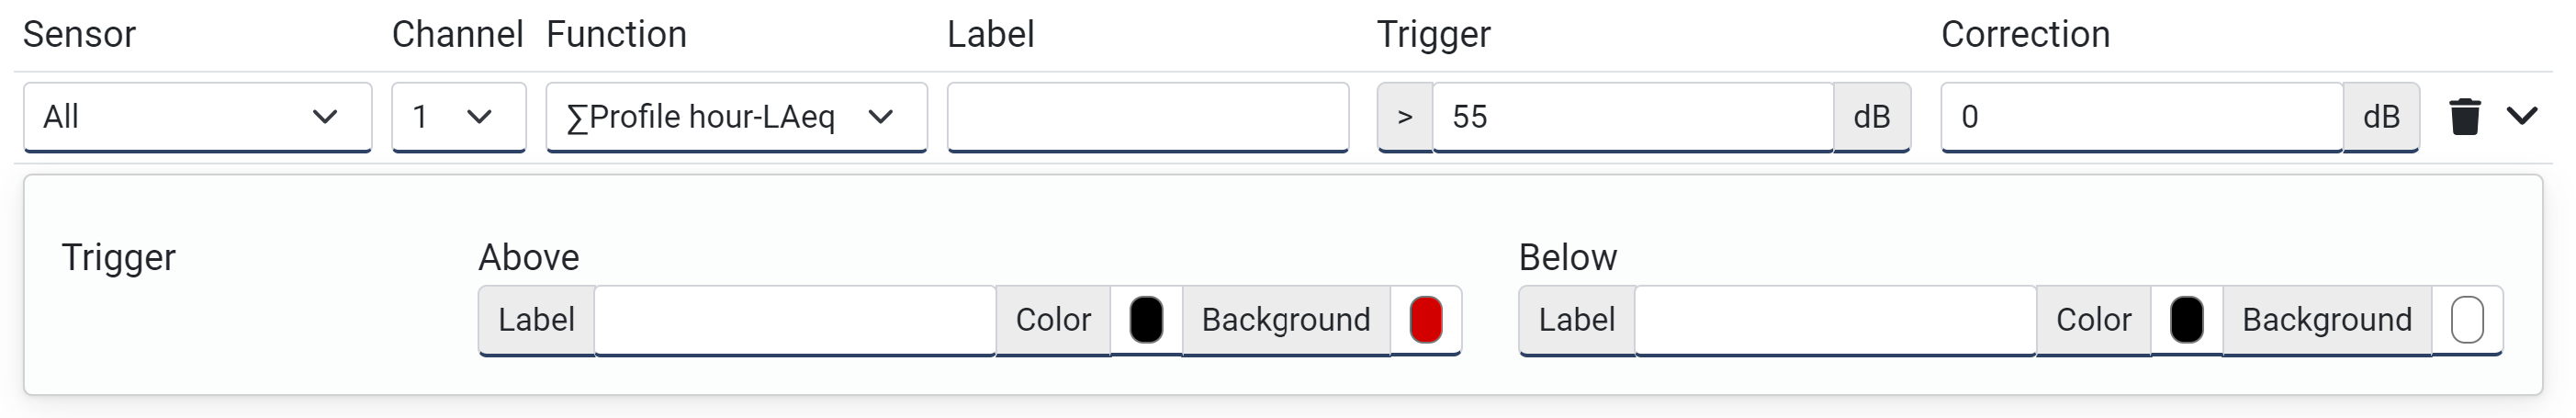
Here you can set custom text formatting if the values are above or below a given number, e.g., a noise limit value. Enter custom Text in the Label field to add extra text whenever the condition occurs. The Color parameter only applies to the extra text given in Label. The background settings applies to the entire cell.
Close the window to save the changes.
After saving the changes, table entries with dummy data is produced to give an impression on how it is going to look.