When the ![]() Add table button is clicked and Highest value combined or separated is selected from the given drop-down menu, a window for setting up the table is shown:
Add table button is clicked and Highest value combined or separated is selected from the given drop-down menu, a window for setting up the table is shown:
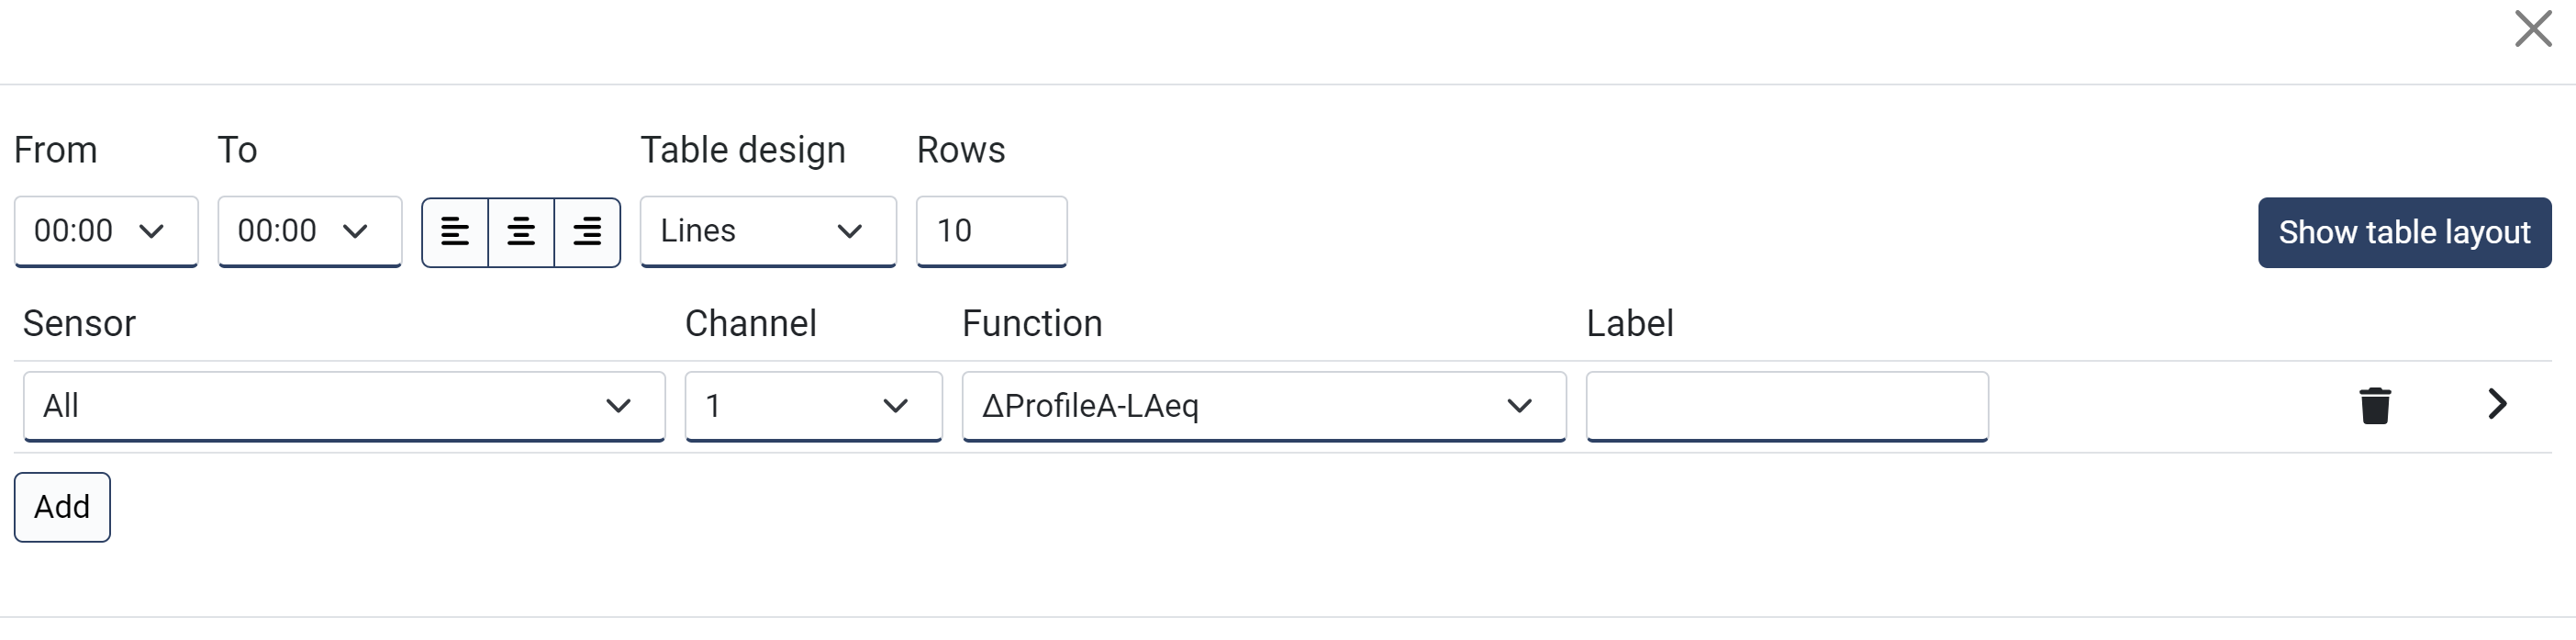
See the add table topic for information about the table layout settings.
The combined table type will merge all values from several instruments into one list. The separated table type will display data from each sensor in a separate column.
In the Rows field, you type the amount of values that should be displayed. I.e., 10 rows will show the 10 highest values.
Column settings (sensor, profile etc.)
Only one line is supported for this table. It has the following properties:
Field name |
Optional / Required |
Data in field |
Information |
|---|---|---|---|
Sensor |
Required |
All or single |
Select what sensor to show data from. If you are creating a generic report for several projects, it is required to use All. Selecting a single sensor will only work in this particular project as the NorCloud sensor ID are unique for each project even if their tic id is the same. |
Channel |
Required |
1 or 2 |
Channel 2 only applies to Nor150. |
Function |
Required |
Profile and function |
Choose from ProfileA or profileB. |
Label |
Optional |
Text |
If nothing is typed here, standard notations are used depending on what profile and function is selected. |