The project dashboard will give you tools to analyze the Project. The different functions are separated under the different "Tabs" in the top of the Dashboard section.
The following tabs are available:
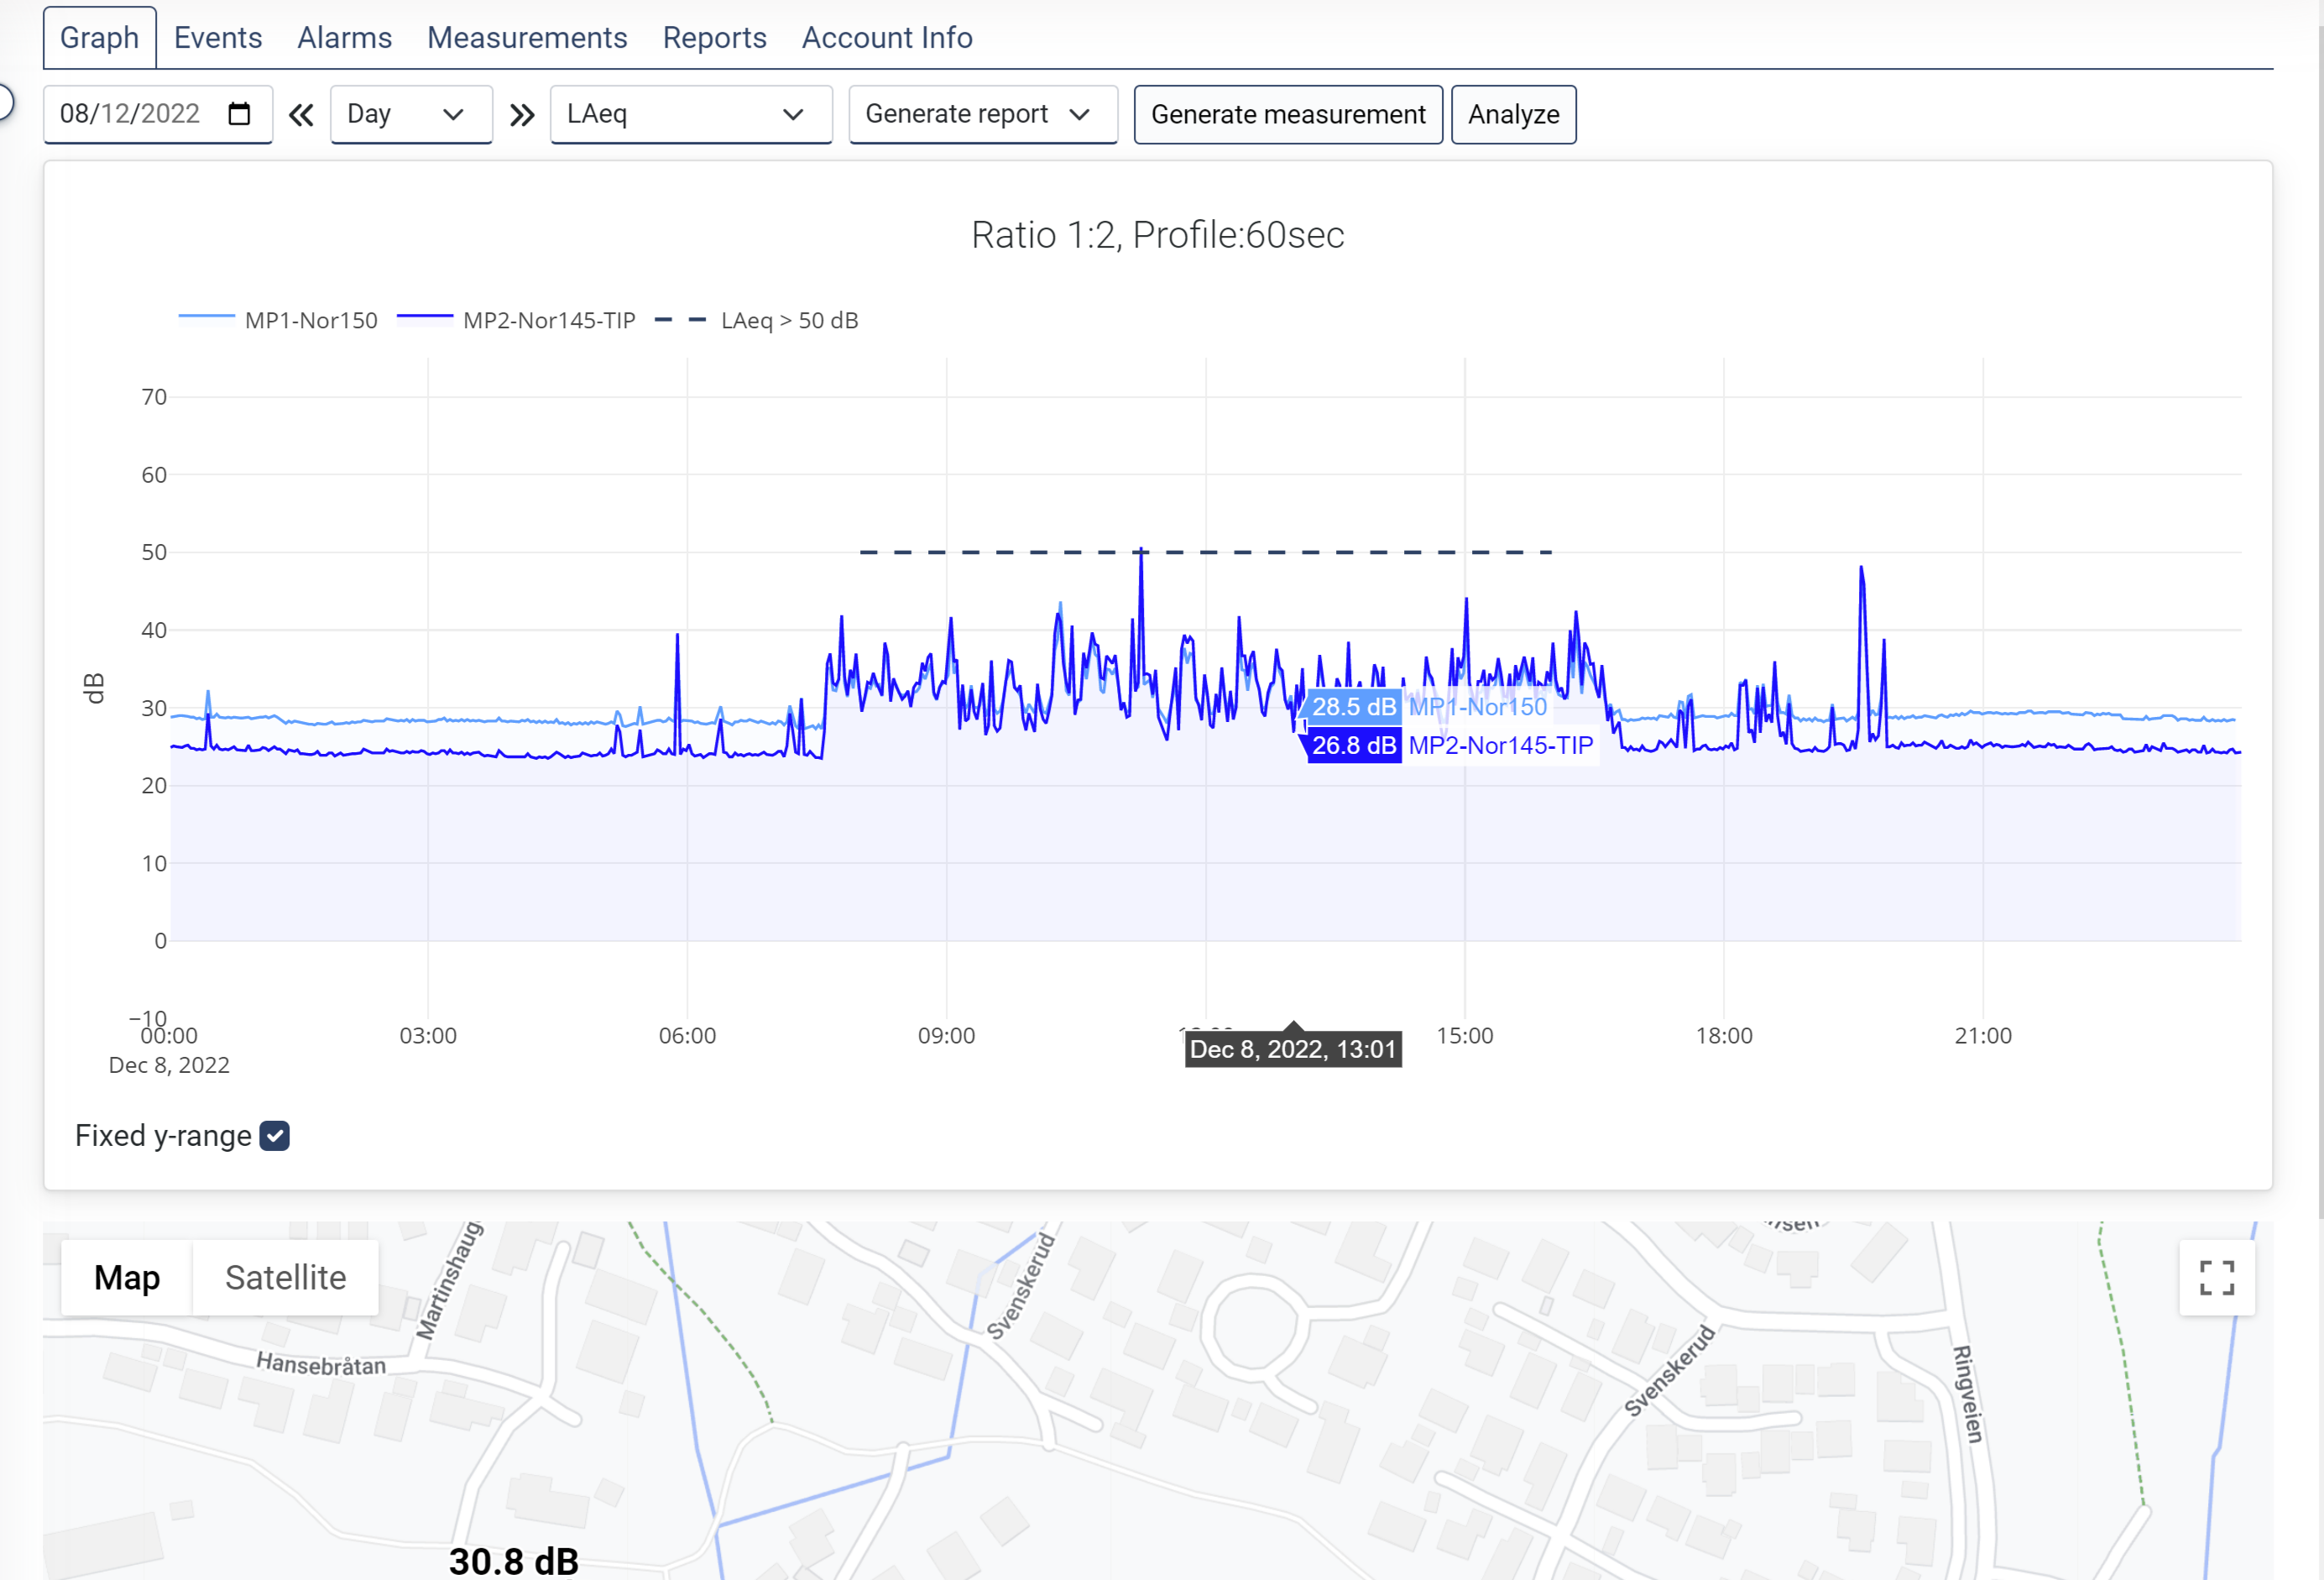
oTime Selector, this is where we select the Date/Day/Week and Selection for each hour.
oData view selector, here you choose what data view is active.
oGenerate report, select a template here to generate a report of the selected time. Also use this if you want to test a report template created in the report designer.
oGenerate Measurement, click on this to download measurement files of the chosen time and sensors.
•Events
Displays a list of Events for the given period of time (default is "current day")
oTime Selector - see above.
•Alarms
A list of System Alarms for the given period of time (default is "current day")
oTime Selector - see above.
•Measurements
A list of all measurement files. You can here make a selection and download the data.
oTime Selector - see above.
•Reports
A list of the reports generated in the time set in the time selector above.
oTime Selector - see above.
•Account Info
Information about credit points spent in this project.