Here you get information about the Events that has been created either by using an automatic event trigger or by setting a manual marker in the Graph.
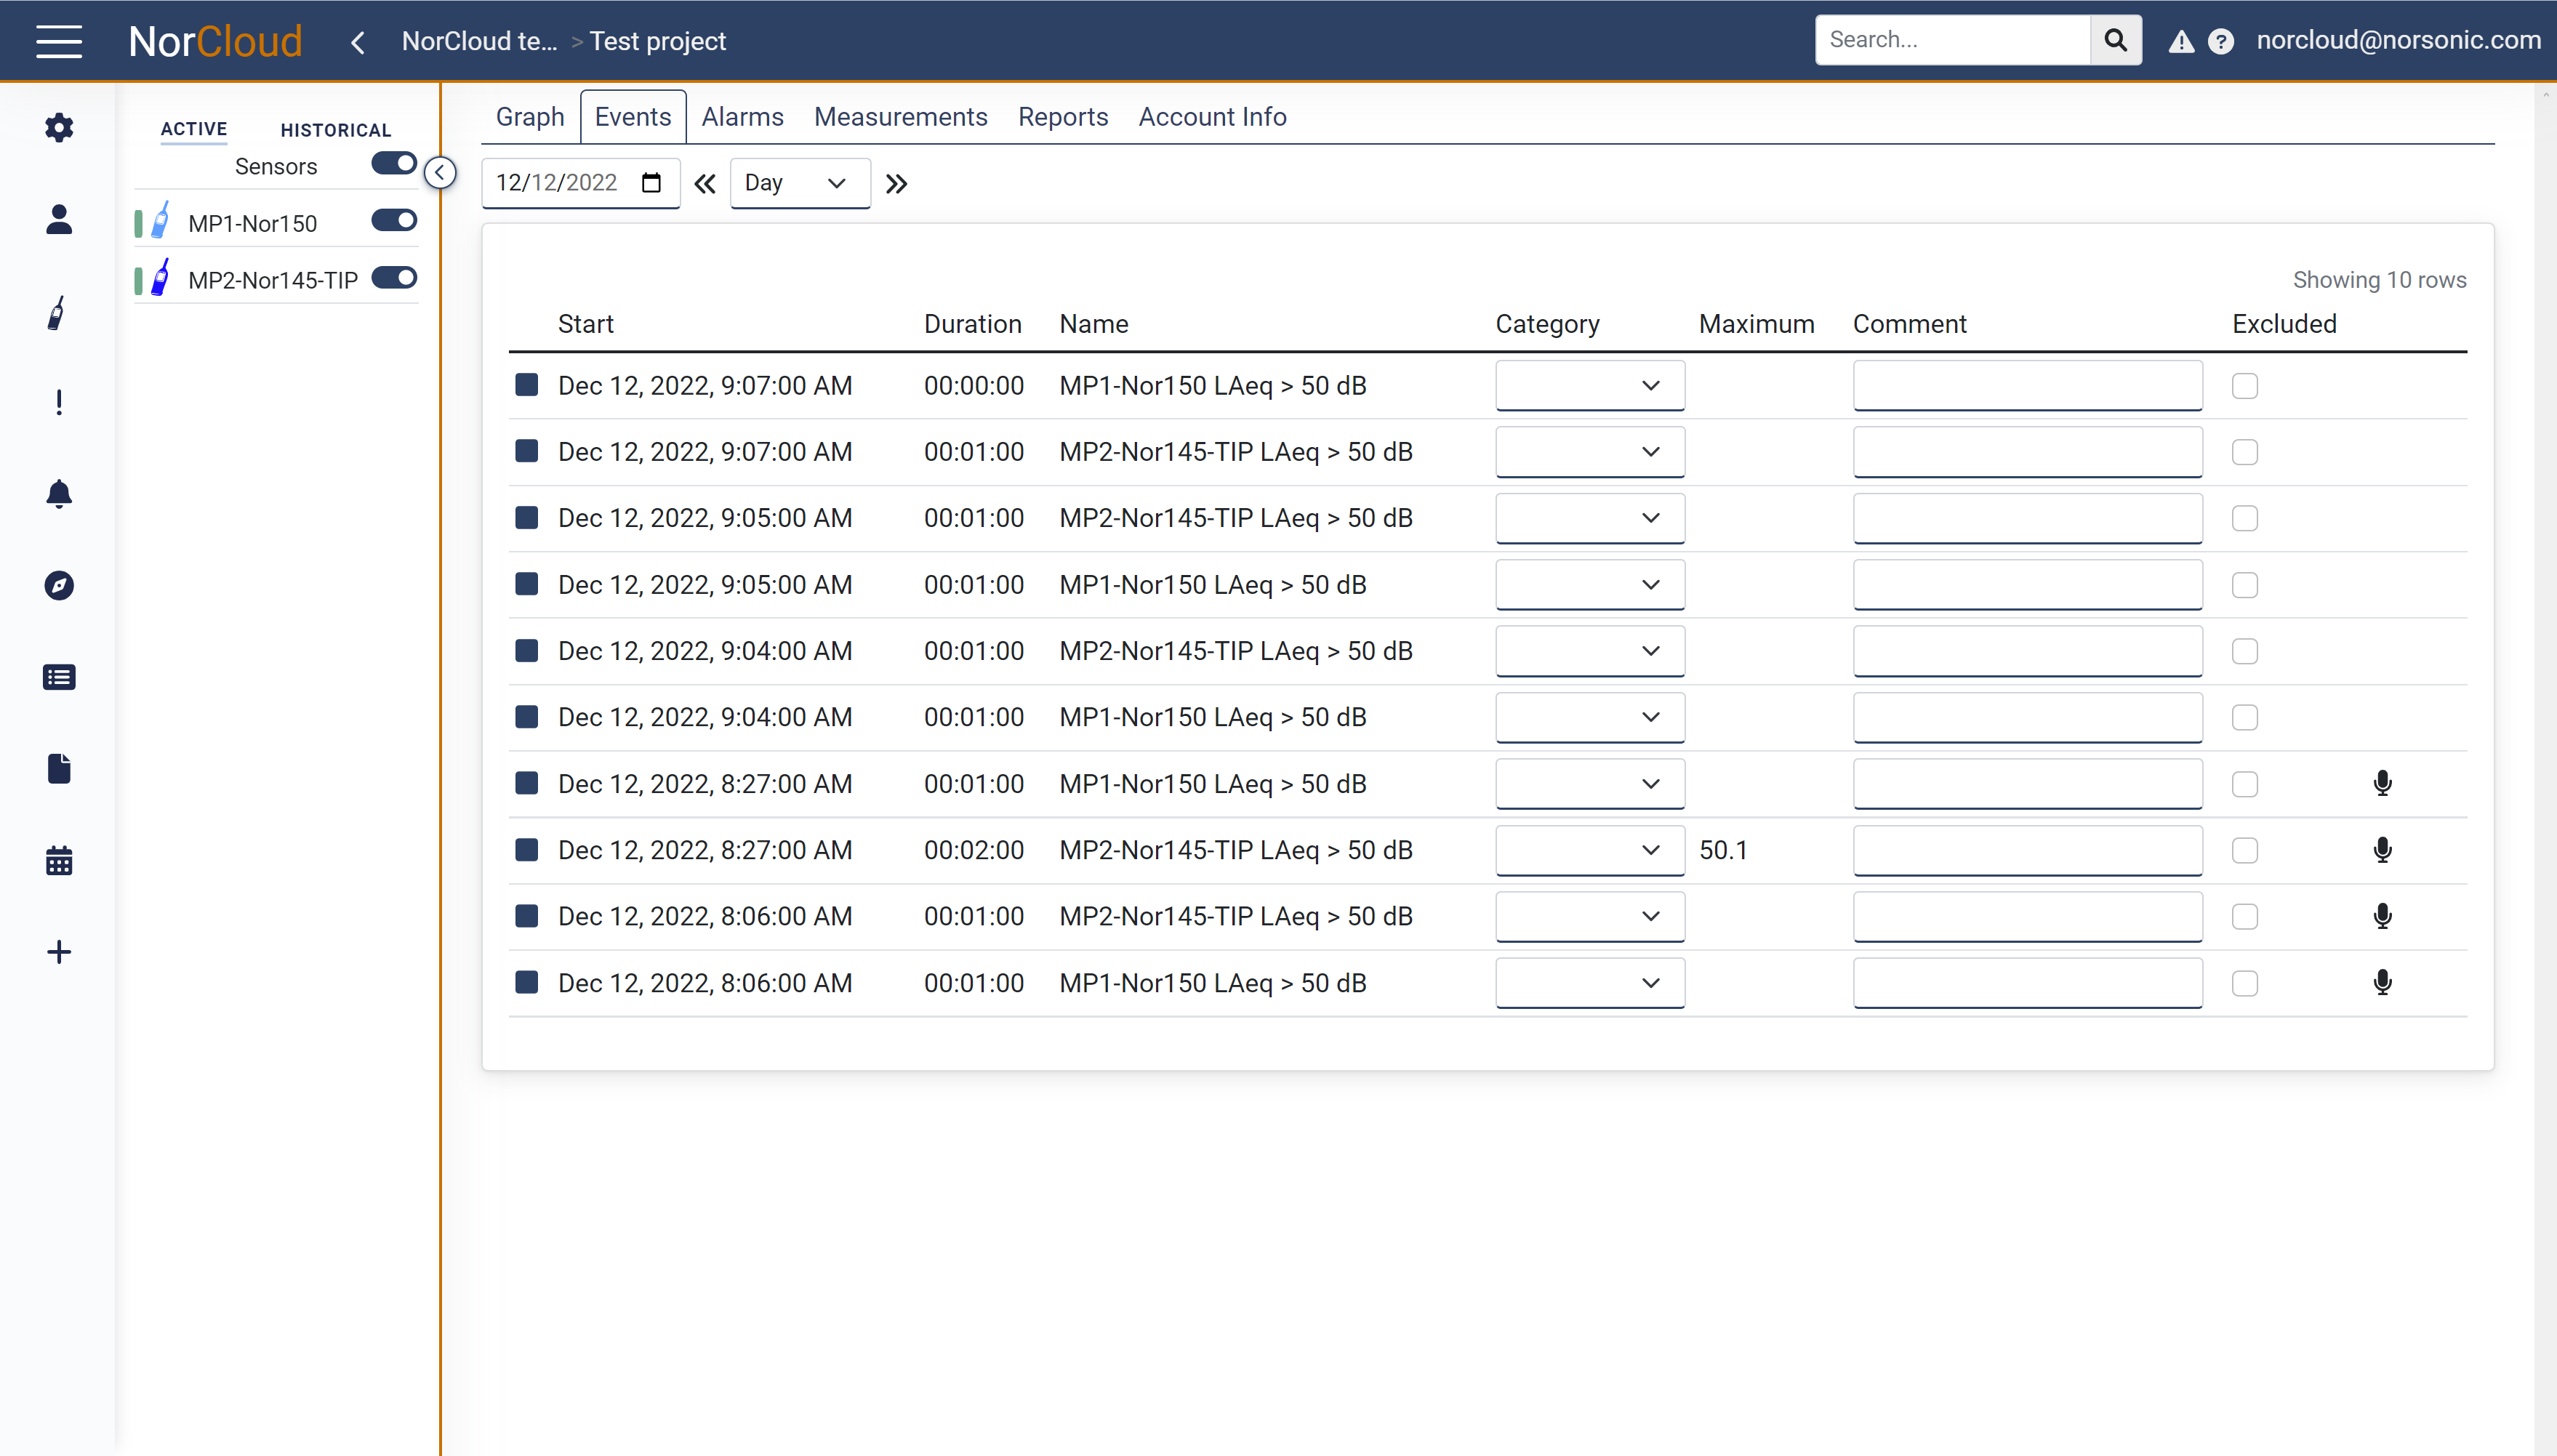
The Event table contains the following information:
Field name |
Optional / Required |
Data in field |
Information |
|---|---|---|---|
Start |
Required |
Fixed date and time |
This is the start date and time for the event. |
Duration |
Required |
Fixed time |
This is the duration of the event. Minimum duration will be the time resolution of the function triggering the event. |
Name |
Required |
Fixed text |
This is the instrument name and then the name for the trigger. |
Category |
Optional |
List box |
Event categories settings from the Event trigger setup. Here you can choose an event category. |
Maximum |
Optional |
Fixed number |
This is the maximum level during the event for the function triggering the event. |
Comment |
Optional |
Text |
This is a free text field to put comments. |
Excluded |
Optional |
Tick box |
This is not implemented yet. |
The right-most column shows different icons depending on what action is available for each event:
![]() Listen to audio recording for a given period of time during the event. Press this to open the audio player.
Listen to audio recording for a given period of time during the event. Press this to open the audio player.
![]() View a picture taken at the time the event occurred, using a connected IP camera.
View a picture taken at the time the event occurred, using a connected IP camera.
Sensor visibility
Sensor visibility can be turned on and off with the switch ![]() . Turning these switches on and off will not affect whether the instrument is measuring (running) or not (idle/saved).
. Turning these switches on and off will not affect whether the instrument is measuring (running) or not (idle/saved).