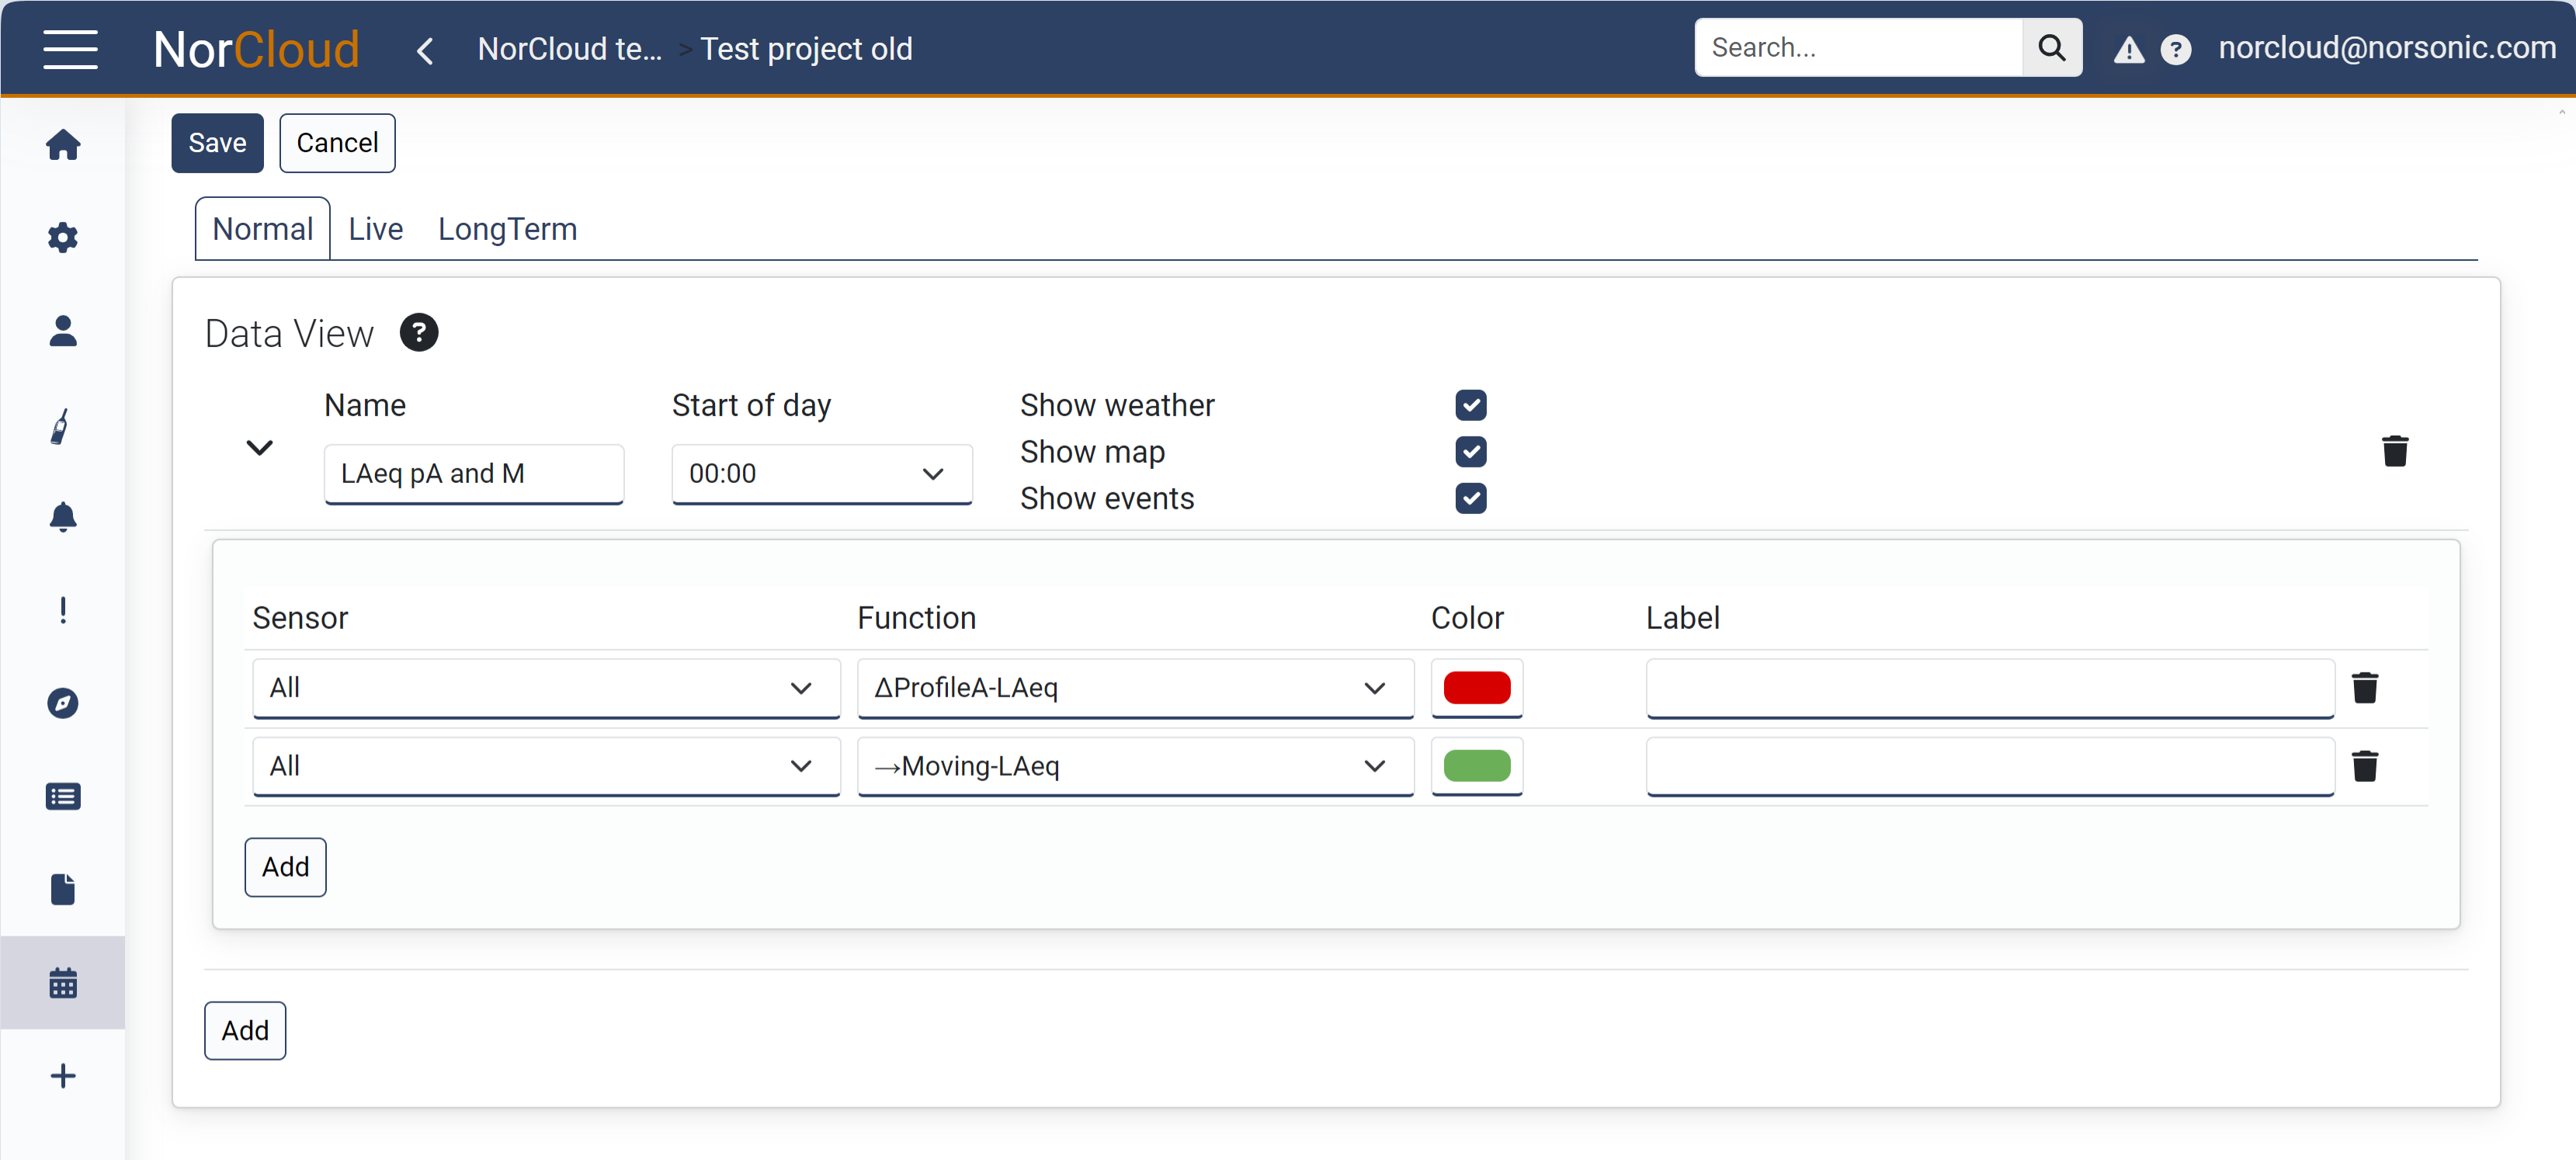
After having done the sound setup, the data view can be set up. A data view defines what will be shown in the Dashboard (formerly Graph) tab of the project.
Click on Data view in the left menu to open the settings. At first the settings are empty. The data views are divided into three tabs:
•Normal: This is the normal view to be shown. It supports all functions with the highest resolutions and up to 4 days of view before switching to long term view.
•Live: The live-mode is updated every second or every minute depending on the measurement upload frequency setting when editing a project. Here you can choose from all the ProfileA functions that are enabled and uploaded to NorCloud in the sound setup. Time profile for the function must be equal or faster than the view, i.e., one second or one minute.
•Long term: This is for long term views, for now up to a month. It supports the global functions and Partial LAeq.
Click on Add to create a new Data view and press the expand button to view all settings:

Data view setup
The data view main settings are as follows:
Field name |
Optional / Required |
Data in field |
Information |
|---|---|---|---|
Name |
Required |
Text |
The name of the view, it will be the name in the list box in the Graph tab for the project. |
Start of day |
Required |
Time |
At what hour of the day should the view start by default. |
Show weather |
Optional in Normal view |
On or off |
This will add the weather data at the bottom of the graph and requires a weather station. |
Show map |
Optional in Normal view |
On or off |
Activate this to make the data view show the map where you can specify where the instrument is located. |
Show events |
Optional in Normal view |
On or off |
This will show the Event list in the main Graph tab at the bottom. |
Sensors for which the graph will be displayed, can be added by clicking the Add button under Sensor. Here are the settings:
Field name |
Optional / Required |
Data in field |
Information |
|---|---|---|---|
Sensor |
Required |
All or one specific |
|
Channel |
Required |
1 or 2 |
|
Function |
Required |
Profile and function |
Profiles and functions are defined in the sound setup and by the type of view described above. Keep in mind that the graph cannot update faster than the time profile selected. A special case for view is Lden where other functions will not be possible to show correctly in the same view. |
Color |
Required |
Color |
If only one function and all sensors are selected in a single line, the default color will be the same as the sensor color in the sensor list, overriding the color defined here. If several functions are selected for all sensors, the corresponding color will be equal to what is set here. To have different colors for different sensors and functions, you have to add a line for each sensor and function separately. |
Label |
Optional |
Text |
If left empty, NorCloud will automatically give a label depending on the profile selected. I.e. profileA LAeq will be named LAeq, profileB LAeq will be named PBLAeq, global LAeq will be named GLAeq and moving LAeq will be named PMLAeq. |
After editing the data view, press the Save button to enable it in the Graph view or press Cancel to discard the changes and go back to the project dashboard.