The project dashboard will give you tools to view and evaluate the Project. The different functions are separated under the different "Tabs" in the top of the Dashboard section.
The following tabs are available as default:
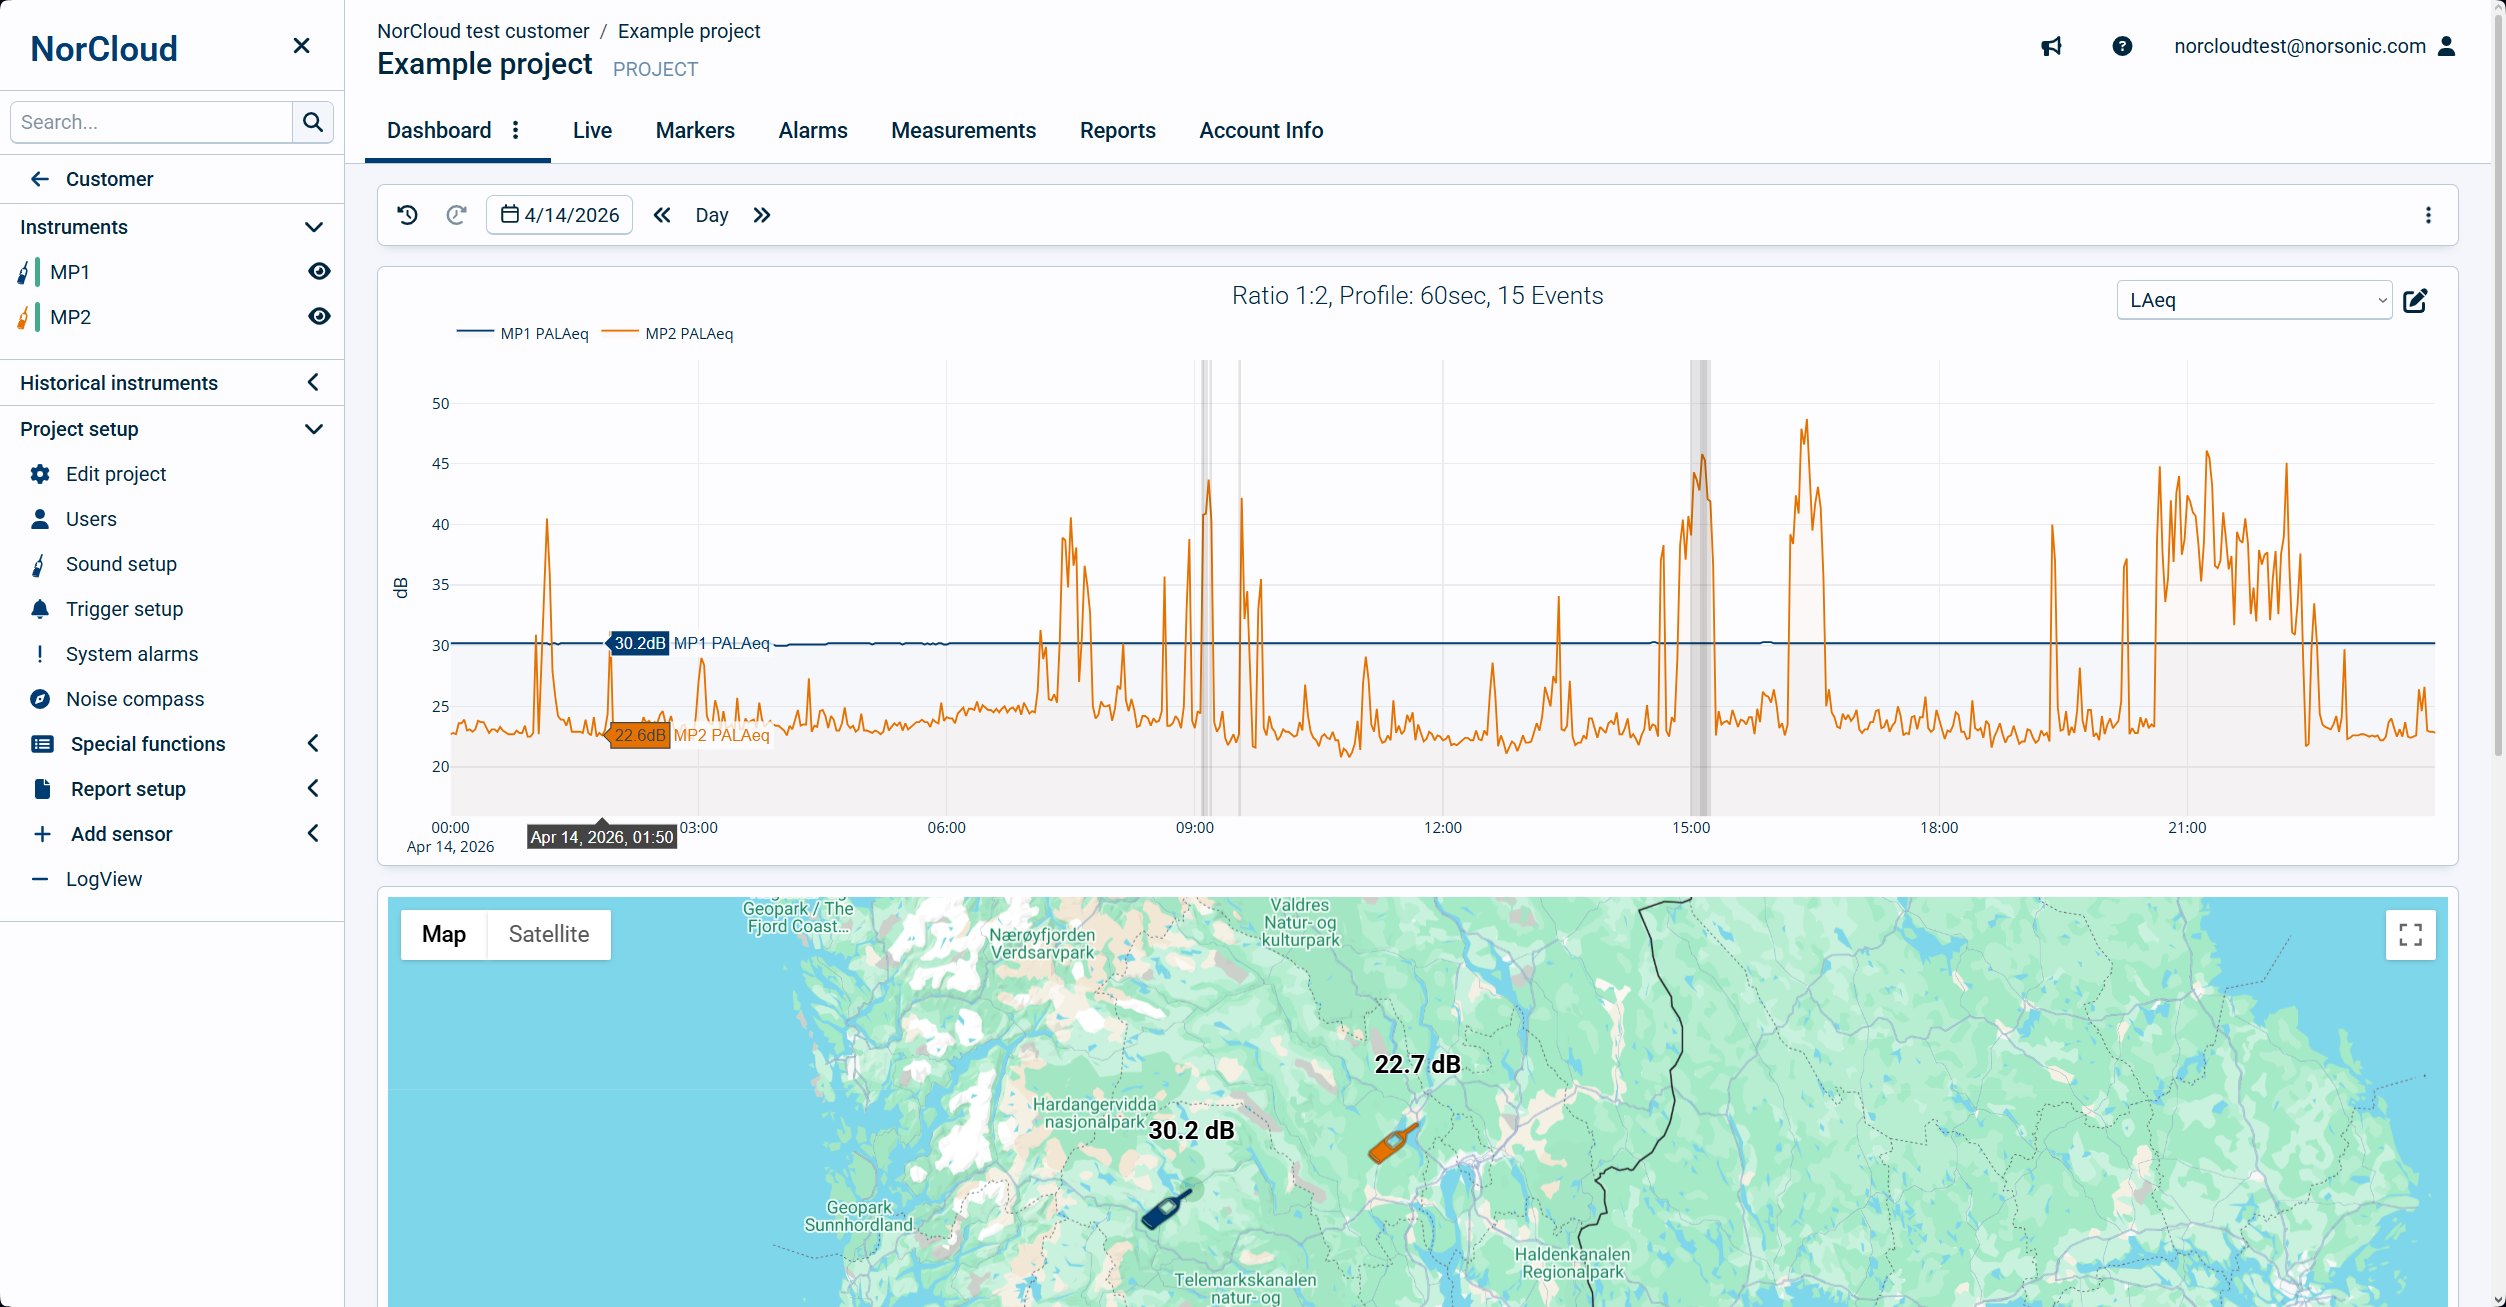
oCalendar selector, to select the date(s) and hours to display.
oTime Selector, this is where we select time spans based on what is selected in the calendar.
oBy default, a graph window, where you also choose which data view is active.
oGenerate report, select a template here to generate a report of the selected time. Also use this if you want to test a report template created in the report designer.
oGenerate Measurement, click on this to download measurement files of the chosen time and sensors.
•Live
oDefault graph displaying live data from the instrument. This requires the project to be set to continuous mode in the project settings.
•Markers
Displays a list of markers for the given period of time (default is "current day")
oTime Selector - see above.
oList of markers where you can filter types of markers.
•Alarms
A list of System Alarms for the given period of time (default is "current day")
oTime Selector - see above.
oList of alarms where you can filter by alarm type.
•Measurements
A list of all measurement files. You can here make a selection and download the data.
oTime Selector - see above.
oList of measurement files where you can filter by channel and what type of measurement.
•Reports
A list of the reports generated in the time set in the time selector above.
oTime Selector - see above.
•Account Info
Information about credit points spent in this project.