After having done the sound setup, the level-time graph can be set up. This defines what will be shown in the Dashboard tab of the project. This setup was previously named Data View, but the menu item has been removed and the setup integrated into the Dashboard of the project.
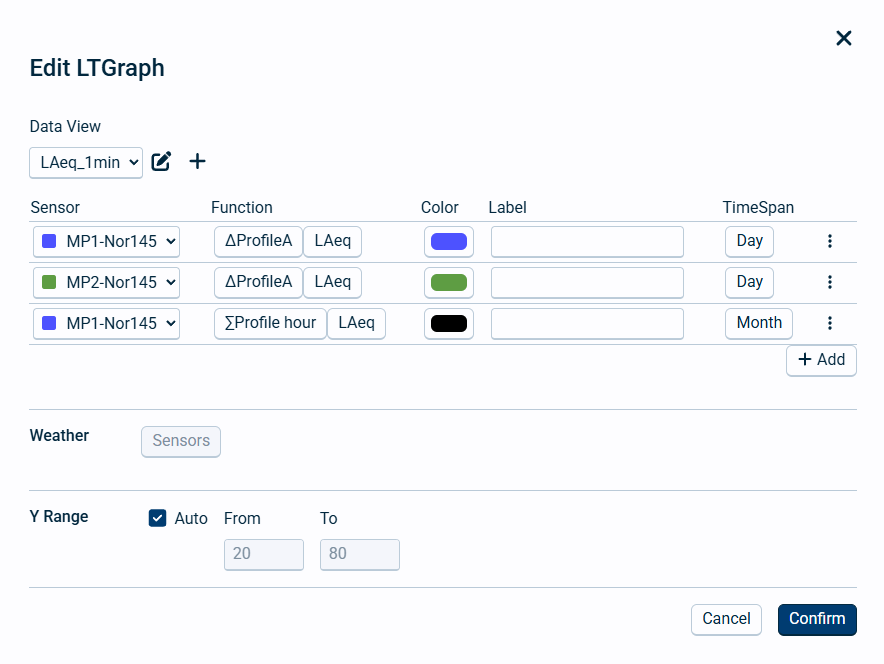
Click on Edit LTGraph icon top right on the L(t) graph window to open the settings. At first the settings are Default, only ProfileA LAeq has been added.
 ,
,
Data View
Here you can select the data view to edit, rename the current data view, add a new data view or delete the current data view. Please note there is a minimum of one data view in all projects.
Functions
Here you can add the functions given from the sound setup. The settings are as follows:
Field name |
Optional / Required |
Data in field |
Information |
|---|---|---|---|
Sensor |
Required |
All or one specific |
Here you select which instrument and channel to display data from. |
Function |
Required |
Profile and function |
Profiles and functions are defined in the sound setup and by the type of view described above. Keep in mind that the graph cannot update faster than the time profile selected. A special case for view is Lden where other functions will not be possible to show correctly in the same view. |
Color |
Required |
Color |
If only one function and all sensors are selected in a single line, the default color will be the same as the sensor color in the sensor list, overriding the color defined here. If several functions are selected for all sensors, the corresponding color will be equal to what is set here. To have different colors for different sensors and functions, you have to add a line for each sensor and function separately. |
Label |
Optional |
Text |
If left empty, NorCloud will automatically give a label depending on the profile selected. I.e. profileA LAeq will be named LAeq, profileB LAeq will be named PBLAeq, global LAeq will be named GLAeq and moving LAeq will be named PMLAeq. |
TimeSpan |
Required |
Day or Month |
TimeSpan is Day or Month. Please note that profileA, profileB or Moving cannot be selected for monthly views. |
Click on Add to add another function to the level-time graph.
Weather
If any weather stations are connected, you can click on this to enable showing weather data below the graph.
Y Range
If y-range i set to Auto, it will start at 10 % below and above the highest value in the graph to be presented. If you know approximately what values to expect and want easier comparisons, use a fixed y-range to do this.
After editing the data view, press the Confirm button to enable it in the project dasboard or press Cancel to discard the changes and go back to the project dashboard.