A quality indicator (QI) has been introduced to evaluate whether the resulting direction is associated to a dominant sound source, or if several sources of similar sound pressure levels are present in the soundscape. The QI value is the norm of the vector obtained by solving the overdetermined system described in the previous chapter.
QI = 1 is achieved when the location of a unique sound source has been identified, with negligible or non-existing sound from other directions. QI = 0 denotes sound coming from multiple directions, approaching a random incidence sound field. This implies that Noise Compass has limited usability indoors. The value of QI in real complex urban soundscapes, however, will always be between 0 and 1: different sound sources with different sound pressure levels contribute to the total level.
If two sources of equal sound pressure and distance from the Noise Compass is located at 0° and 180° horizontal, and both at 0° vertical, the quality indicator will be 0 and angle indicated randomly.
If the two sources have unequal sound pressure, say -3 dB on the one at 180°, the quality indicator will be approx. 0.7, and the indicated angle will be 0° for horizontal and 0° for vertical.
The first image below shows the case of QI = 0,4, where several sound sources contribute to the measured sound pressure level of LAeq,100ms = 46,5 dB. Low QI values are typically associated to lower noise levels without a clear dominant source, like the case shown in the figure, but they can also take place if several sound sources emit higher sound pressure levels simultaneously. The second image below, on the other hand, shows the case of a unique sound source dominating the sound measurement, with a calculated quality indicator QI = 0,9. In this case, sound from sound sources located at other directions is still present in the measurement, but the level of these sound sources is much lower compared to the level of the sound propagating in the identified direction.
Reflecting planes close to the Noise Compass will also provide mirror sources of incident sound and will affect the results.
 and resulting direction of sound source. The length of the arrow indicates a low QI. Right: The calculated QI = 0,4 denotes that the identified directions, in azimuth and elevation, are affected by several noise sources with similar sound pressure levels.")
Left: placement of the noise monitoring station, with measured sound pressure level (given as LAeq,100ms) and resulting direction of sound source. The length of the arrow indicates a low QI.
Right: The calculated QI = 0,4 denotes that the identified directions, in azimuth and elevation, are affected by several noise sources with similar sound pressure levels.
 and resulting direction of sound source. The length of the arrow indicates a high QI. Right: The calculated QI = 0,9 denotes that the identified directions, in azimuth and elevation, correspond to a dominating sound source with much higher sound pressure level than the other sources present.")
Left: placement of the noise monitoring station, with measured sound pressure level (given as LAeq,100ms) and resulting direction of sound source. The length of the arrow indicates a high QI.
Right: The calculated QI = 0,9 denotes that the identified directions, in azimuth and elevation, correspond to a dominating sound source with much higher sound pressure level than the other sources present.
Measurement error
Measurement accuracy is defined as the closeness of agreement between a measured quantity value and a true quantity value. A measurement is said to be more accurate when it offers a smaller measurement error.
The table below shows average standard deviation of the measurement error for 0º and 40º incidence, in the horizontal plane, for 130 Noise compass units. The standard deviations were computed separately for the horizontal and vertical components of the error.
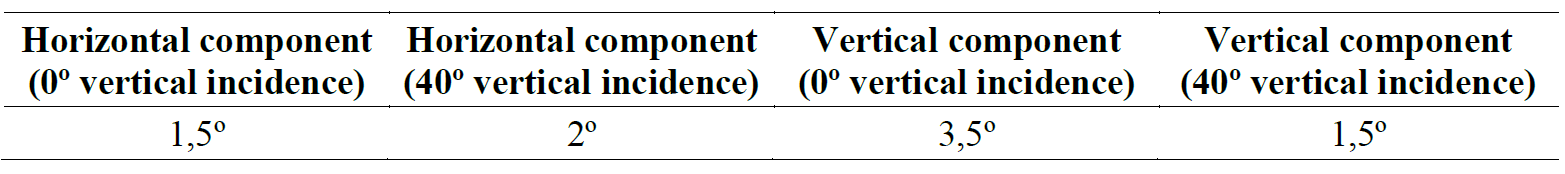
The largest error component is found when localizing sound sources at 0º vertical incidence, since the reference point is located symmetrically between the two rows of microphones. The error is then biased and follows the vertical direction of the closest microphone.
In all cases, the maximum error was found to be well within the following tolerances: ±7,5º for horizontal components and ±10º for vertical components. This error must be considered when defining monitoring zones.