|
<< Click to Display Table of Contents >> Navigation: »No topics above this level« Noise compass data - graph view |
“Noise Compass” data
The Nor145 and Nor150 analyzers can be used with the Nor1297 "Noise Compass" to define noise sectors when measuring and use these as an additional criteria to enhance the event handling.
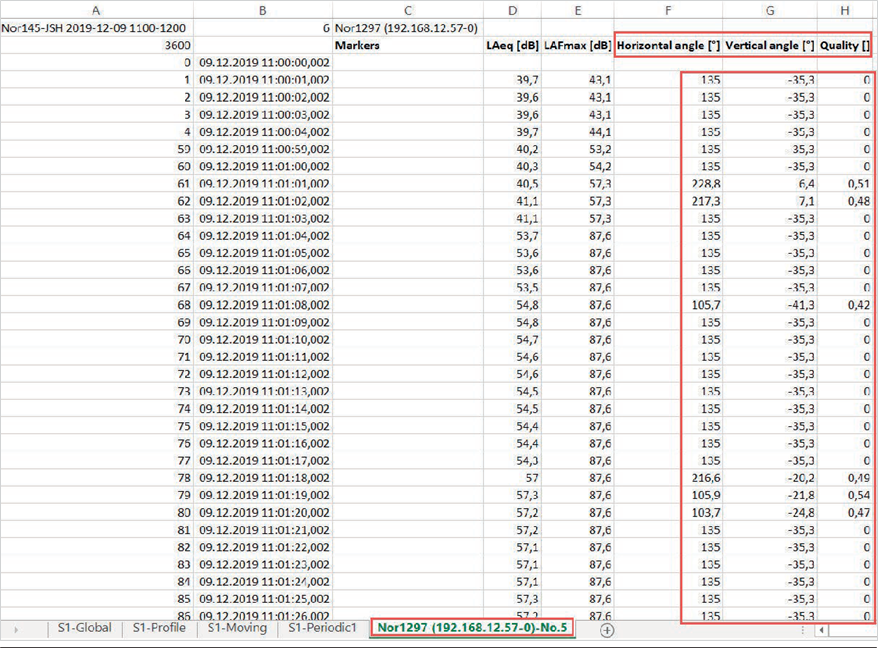
The functions setup and reported from this device:
Horizontal angle
Vertical angle
Quality indicator
These can be displayed in the "Graph view" alongside the other Profile functions.
The results are stored and can be exported to the "Overview" Excel report in a separate tab as part of the Profile data as shown.
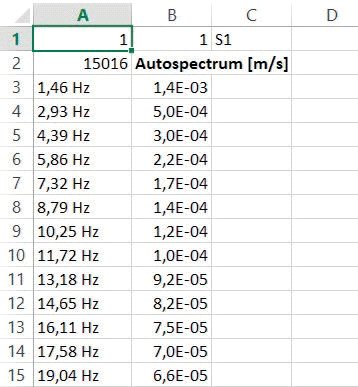
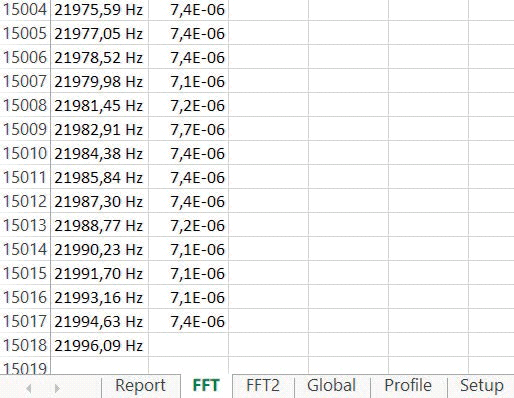
If the measurements include FFT data these are reported as follows. PS! Only low- and high ends of the frequency range are shown.