Graph View - General Analyser - vibration sensors

|
<< Click to Display Table of Contents >> Navigation: Graph View > Graph View - General Analyser - vibration sensors
|
Vibration data
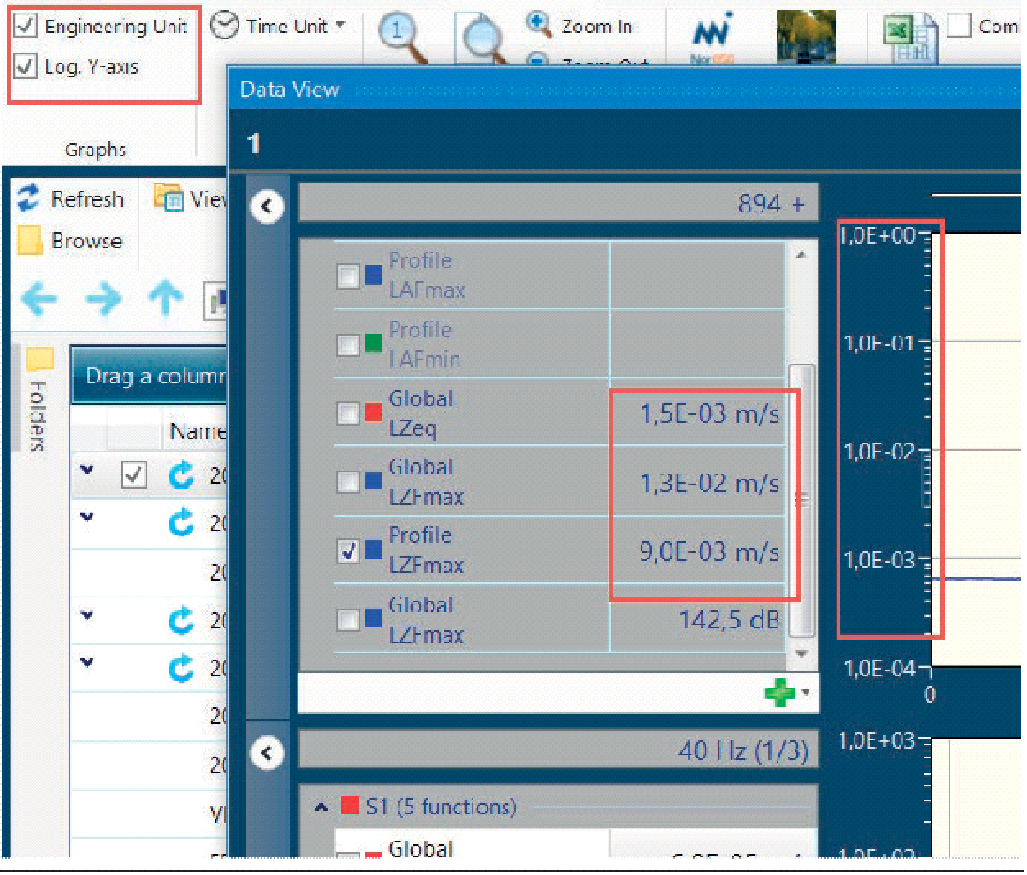
It is possible to display linear units and have a logarithmic Y-axis, which makes it easier to interpret vibration data, ie. acceleration (m/s2) or (velocity) mm/s:
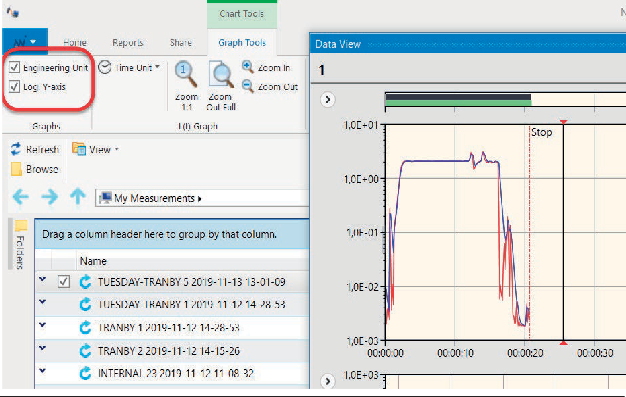
To show the vibration results, for example from an accelerometer in m/s2 or and then display this in the L(t) view
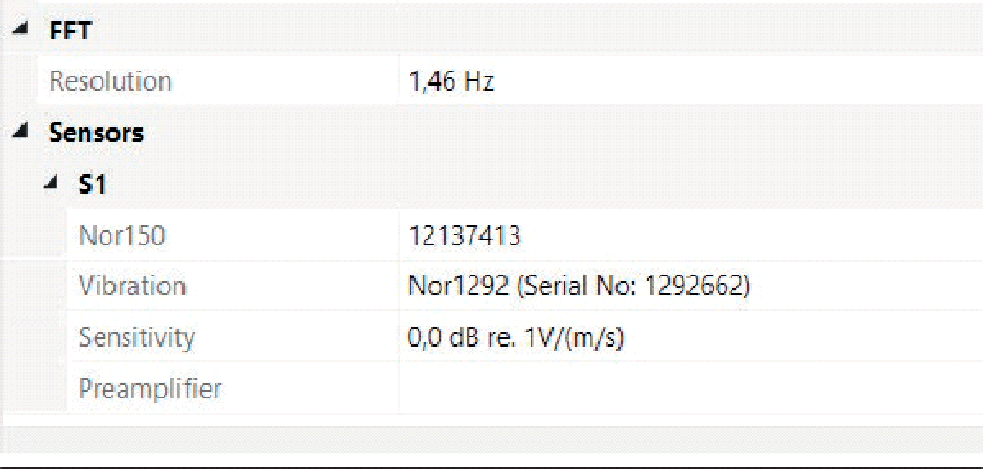
The information window for an example using a Nor1292 geophone (velocity measurements in m/s). Figure 3.25.
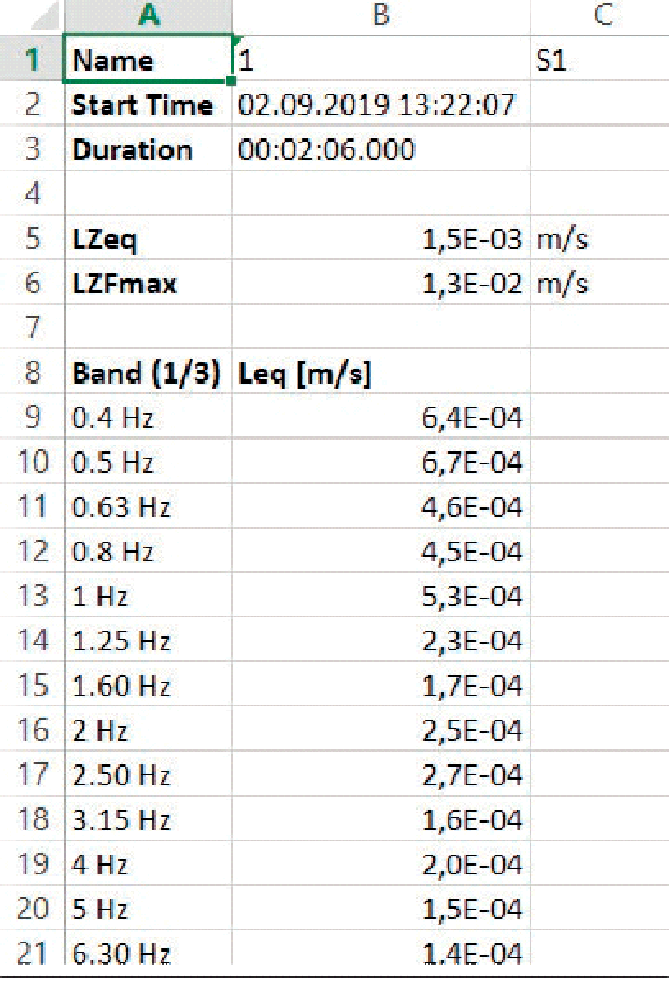
The resulting Excel report: Excel report with linear units