Graph View - General Analy

ser
|
<< Click to Display Table of Contents >> Navigation: Graph View > Graph View - General Analyser
|
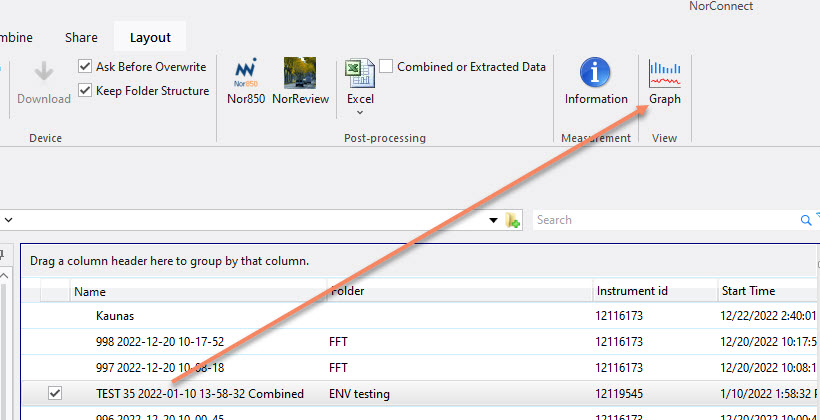
For “General Analyser” measurements you may use the “Graph view” function to show the content of the Profile part of a measurement. Just double-click on the file to open this, alternatively click on the chosen file, the toolbar will activate, then click on “Graph view”
The measurement data is presented as a level vs. time- and frequency view for the General Analyser files. You also access an associated menu bar with functions as shown
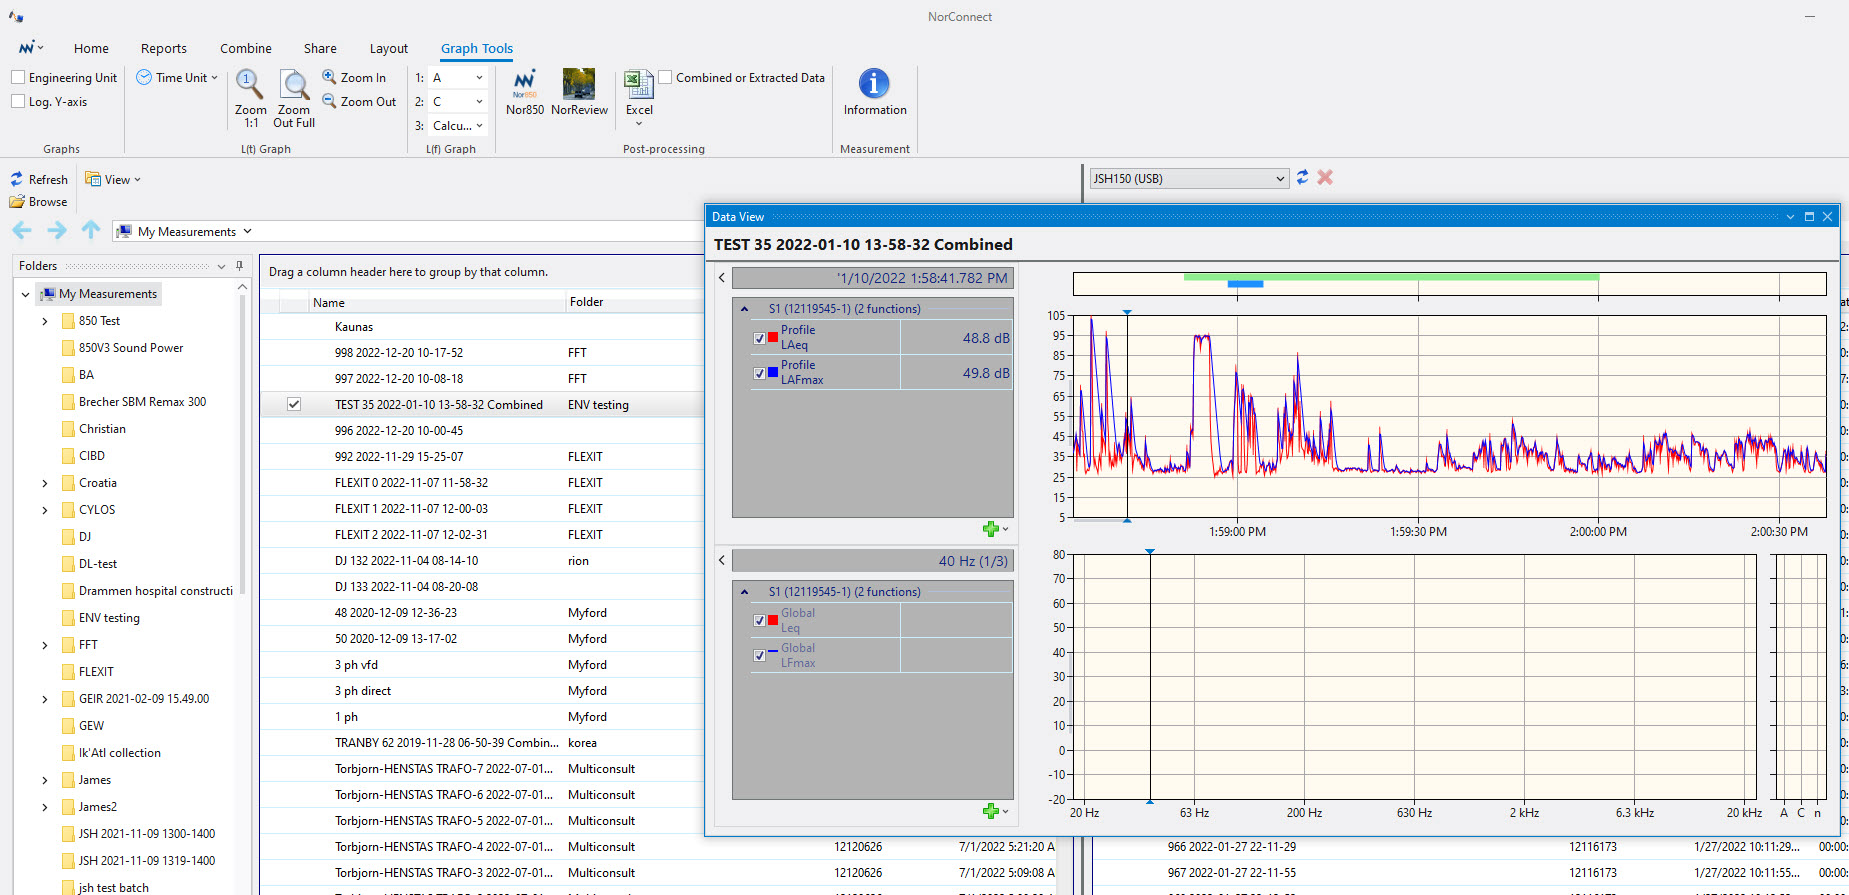
You may also use Zoom in/out functions as found under “graph tools” and listen to audio recordings using the standard Windows Media Player. The audio recordings are shown as markers).
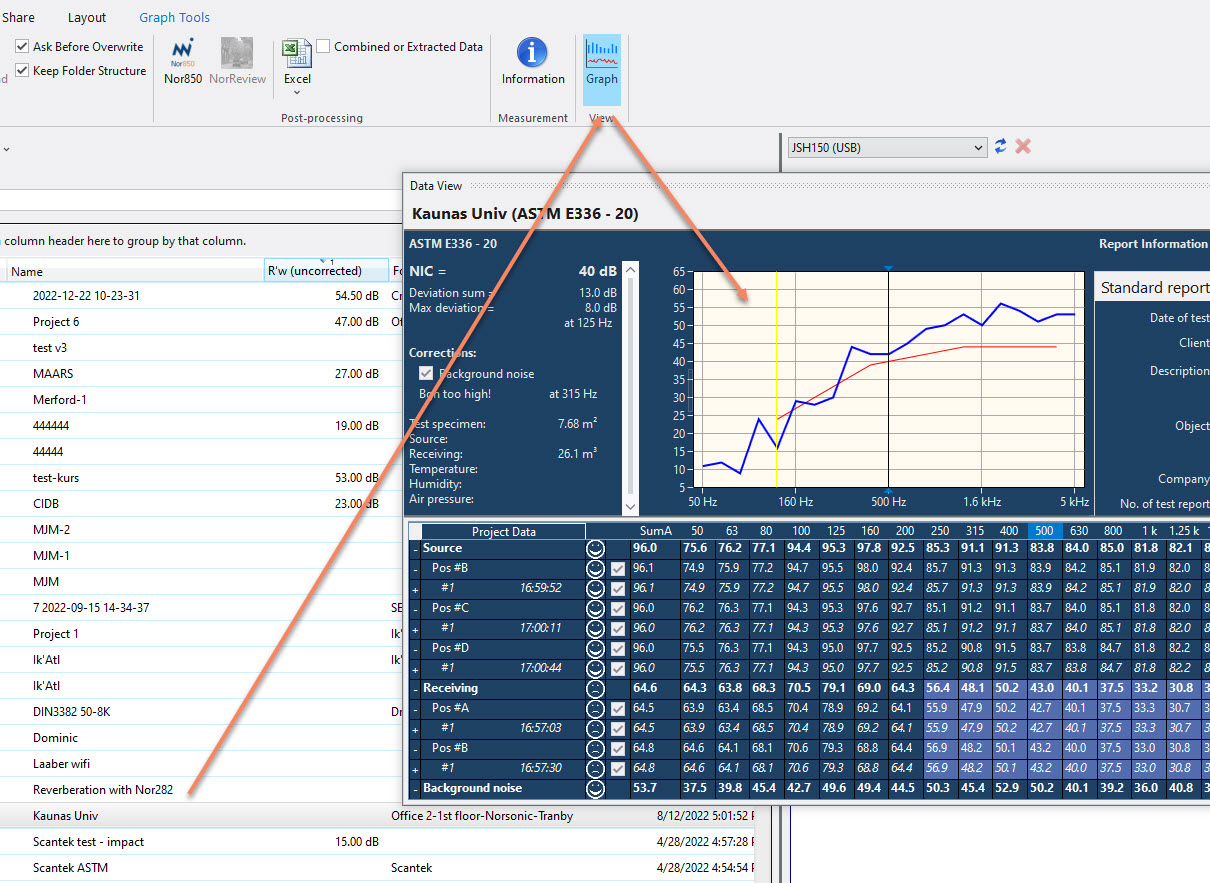
For Building Acoustics (BA) and Sound Power (SP) measurements clicking the “Graph view” button produces the respective reports as examplified here